
Every spring, summer, and early fall, millions of people in Melbourne and beyond face the same problem: sneezing, itchy eyes, and breathing trouble - not from a cold, but from pollen. If you’ve ever canceled a picnic, cut a run short, or spent an afternoon indoors because your nose wouldn’t stop running, you know how unpredictable and exhausting allergy season can be. But here’s the good news: you don’t have to guess when pollen is high. Pollen forecasting gives you a clear, science-backed way to plan your days - so you can enjoy the outdoors without paying the price.
How Pollen Forecasts Work (And Why They’re More Accurate Than Ever)
Pollen forecasts aren’t just weather predictions with a twist. They’re complex models that track real-time data - temperature, wind, humidity, rainfall - and combine it with decades of pollen records to predict how much allergen will be in the air each day. In Melbourne, where grass pollen peaks from October to December, these forecasts are especially valuable.
Modern systems like BreezoMeter and the Copernicus Atmosphere Monitoring Service use satellite imagery, ground sensors, and machine learning to predict pollen levels down to 1.5 kilometers. That means your forecast for Carlton might be very different from one in Box Hill, even if you’re only 10 minutes apart. These systems don’t just count pollen - they track where it’s coming from, how it’s moving, and when it’s likely to drop.
Accuracy has improved dramatically. While early forecasts in the 1990s were only about 60% reliable, today’s models hit 82-89% accuracy for daily predictions. That’s because they’re no longer just looking at past averages. They’re reacting to real-time changes - like a sudden wind shift from the Yarra River or a dry spell after rain.
What the Numbers Mean: Low, Moderate, High, Very High
Pollen counts are measured in grains per cubic meter of air. But what does that actually mean for you? Here’s what the numbers look like in practice:
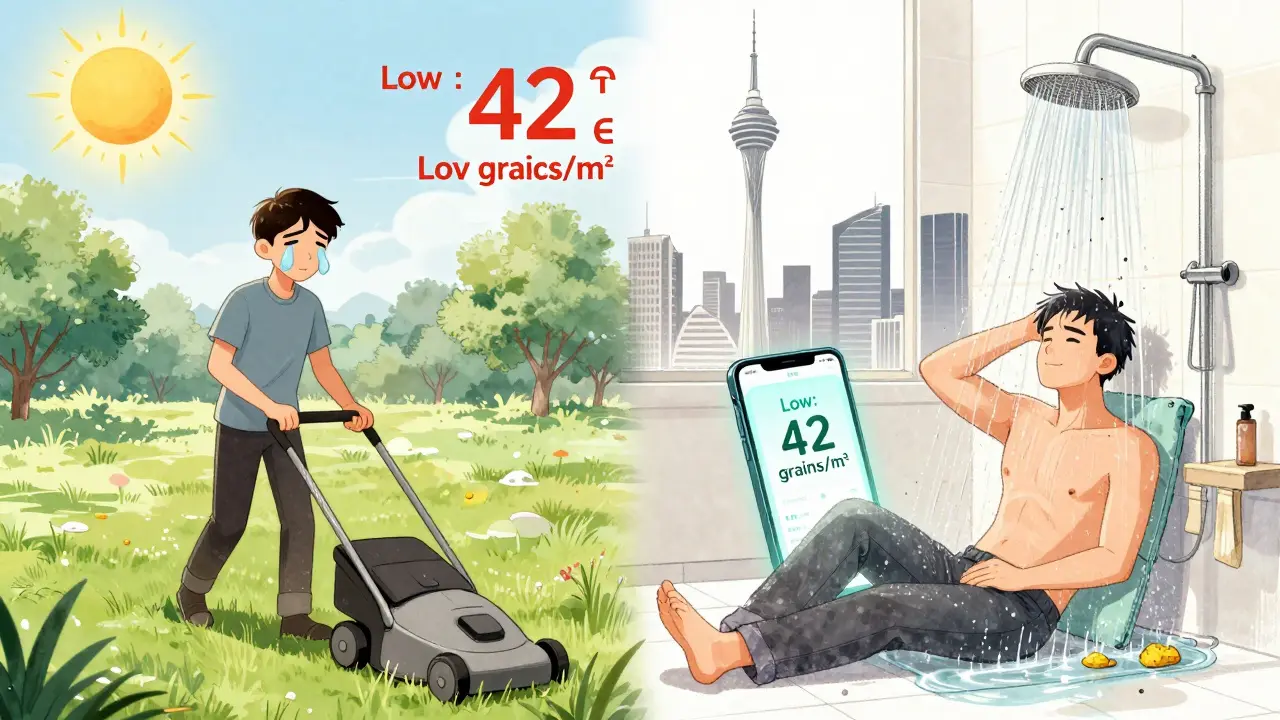
- Low (≤50 grains/m³): Most people with allergies won’t notice symptoms. Safe for outdoor activities.
- Moderate (51-149 grains/m³): Sensitive individuals may start feeling itchy eyes or a runny nose. Consider limiting prolonged outdoor time.
- High (150-499 grains/m³): Almost everyone with pollen allergies will have symptoms. Avoid extended time outside, especially midday.
- Very High (≥500 grains/m³): Dangerous levels. Even healthy people can react. Stay indoors if you can.
For ragweed and some weed pollens, thresholds are lower - as low as 20 grains/m³ counts as high. That’s why knowing your specific trigger matters. In Melbourne, the main offender is ryegrass, which spikes hard in spring. If you’re allergic to tree pollen, your peak is earlier - usually August to October.
When Pollen Is Worst: Timing Your Day Right
It’s not just about which day is bad - it’s about which time of day. Pollen follows a daily rhythm:
- Early morning (5-10 AM): Tree pollen peaks. If you’re allergic to oak, birch, or eucalyptus, this is your worst window.
- Midday to afternoon (10 AM-4 PM): Grass pollen soars. This is the hardest time for Melbourne residents during spring.
- Late afternoon (4-8 PM): Weed pollen rises, especially ragweed and plantain.
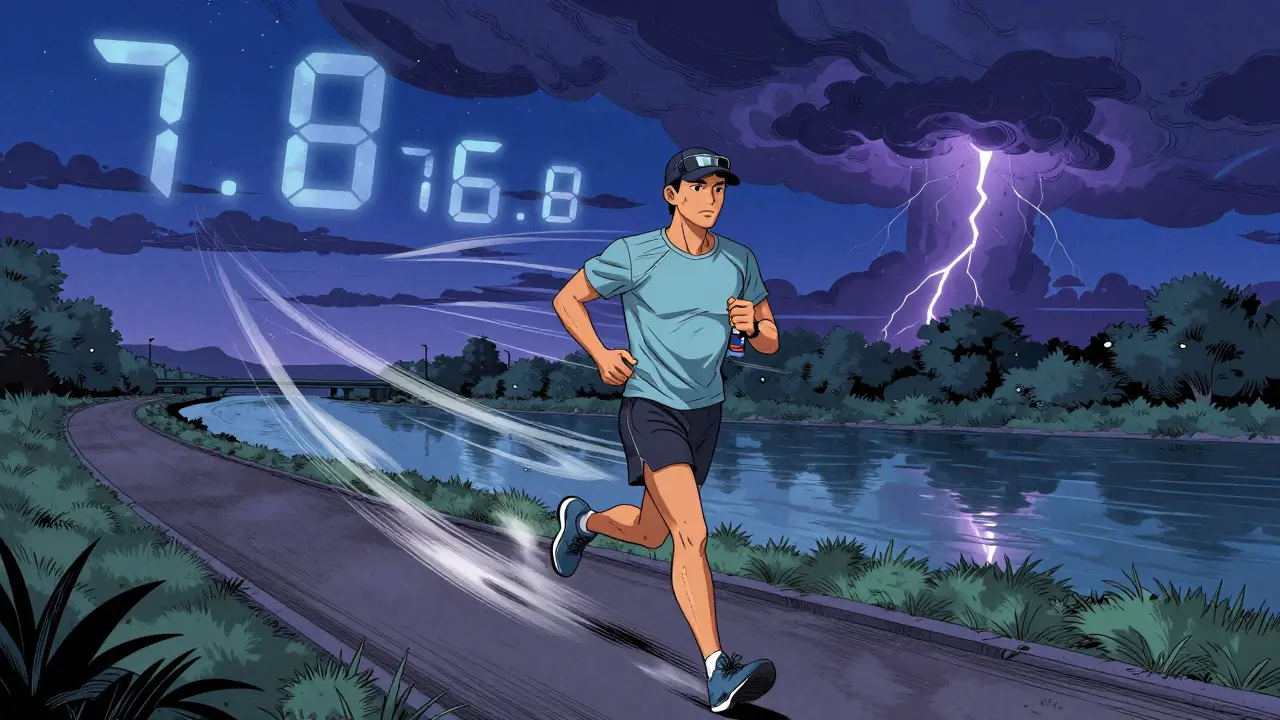
- Early evening (7-9 PM): Pollen levels drop 30-50% after sunset. This is the safest window for walking, jogging, or gardening.
One study found that runners who shifted their workouts from noon to 7-9 AM during peak grass season reduced respiratory symptoms by 45%. That’s not just comfort - it’s performance. If you’re training for a race, a weekend hike, or even just want to play with your kids in the backyard, timing matters more than you think.
How Rain, Wind, and Dry Days Change Everything
Weather doesn’t just affect how you dress - it changes your pollen risk.
- Rain: A light shower (0.1 inch or more) can wash pollen out of the air. Counts drop 30-50% within two hours. But avoid going out right after rain - the damp ground can stir up mold and re-release pollen when it dries.
- Wind: A 10 mph breeze can double pollen dispersal. Windy days, especially from the north or east, mean trouble. If the forecast says “northwesterly winds,” expect high counts.
- Dry, hot days: These are the worst. Heat increases pollen production, and dry air lets it float farther. In Melbourne, a 2-3°C rise in temperature can spike pollen counts by 15-20%.
- Thunderstorms: This is the hidden danger. In 2016, Melbourne had a record thunderstorm asthma event. Pollen grains burst open in the storm, releasing tiny particles that flooded the air. Even people with no history of allergies had severe reactions. Forecasts still can’t predict these reliably - so if a storm’s coming, stay indoors.
How to Use Forecasts Like a Pro
Checking a forecast once a week won’t cut it. Here’s how to use them effectively:
- Use at least two sources. BreezoMeter, Pollen.com, and the Bureau of Meteorology all give slightly different readings. Cross-checking gives you a clearer picture.
- Know your local pollen type. In Melbourne, ryegrass is the main culprit. In other areas, it might be olive, cedar, or ragweed. Don’t assume your symptoms are from the same pollen as your neighbor’s.
- Plan high-priority activities for low-pollen times. Schedule outdoor workouts, school sports, or weekend trips for early morning or evening on low-pollen days.
- Combine with symptom tracking. Apps like Allergy Tracker let you log how you feel each day. Over time, you’ll see patterns - like “I always react on days when the wind hits 15 km/h.”
- Don’t trust one app blindly. One user on Reddit said, “The app said low grass pollen, but I had to use three antihistamines after mowing.” That’s because mowing stirs up ground pollen - something forecasts can’t predict. Use forecasts as a guide, not a guarantee.
Who Benefits the Most - And How
Pollen forecasts aren’t just for people with diagnosed allergies. They help:
- Athletes: Runners, cyclists, and triathletes use forecasts to avoid performance-sapping inflammation. The New England Patriots and Manchester United track pollen levels for training schedules.
- Parents: 72% of parents with allergic kids check forecasts daily. It helps them decide when to let kids play outside, skip school sports, or reschedule playdates.
- Seniors: Older adults with asthma or COPD are especially vulnerable. A 2023 study showed forecast-guided planning reduced ER visits by 22% during peak season.
- Teachers and school staff: Over 20 U.S. school districts now delay outdoor activities on high-pollen days. Melbourne schools are starting to follow.
The data is clear: people who use forecasts consistently report 63% less medication use and 78% fewer symptoms. That’s not just convenience - it’s better health, better sleep, and more energy.
What’s Next? The Future of Pollen Forecasting
Pollen seasons are getting longer. Since 1990, the U.S. pollen season has extended by over 20 days, with 21% more pollen in the air. Climate change is making this worse - warmer winters mean plants start releasing pollen earlier, and drier summers mean it lasts longer.
New tech is coming fast. In 2025, the European Space Agency plans to launch PollenSat - a satellite that will map global pollen types from space. Apple and BreezoMeter are integrating pollen data with heart rate and breathing patterns to give personalized alerts. The NIH is funding AI models to predict thunderstorm asthma before it happens.
But for now, the best tool you have is already available - free or low-cost apps, local weather services, and a little awareness. You don’t need to wait for the future. Start using today’s forecasts to protect your health tomorrow.
Real-Life Tips from People Who’ve Mastered Pollen Season
Here’s what users on Reddit and Allergic Living forums say works:
- “I check the forecast every night before bed. If it’s high, I change my morning run to after work.” - u/AllergyWarrior89
- “I keep a small bottle of saline spray in my car. After driving on high-pollen days, I rinse my nose. It cuts my symptoms in half.” - Lisa, Geelong
- “I don’t hang laundry outside during spring. Even if it’s sunny, pollen sticks to sheets and pajamas.” - Mark, Hawthorn
- “I wear sunglasses and a hat on windy days. It stops pollen from getting in my eyes and hair.” - Priya, Fitzroy
- “I shower and change clothes right after coming inside. Pollen clings to skin and clothes - washing it off helps.” - James, South Yarra
Small changes add up. You don’t need to give up the outdoors. You just need to outsmart the pollen.
What time of day has the lowest pollen count?
Pollen counts are usually lowest between 5-7 AM and 7-9 PM. Early morning before sunrise and early evening after sunset are the safest times for outdoor activities. Tree pollen peaks before 10 AM, grass pollen peaks midday, and weed pollen peaks in the late afternoon. Avoiding these peaks can reduce your exposure by 30-50%.
Can rain really reduce pollen?
Yes - light to moderate rain (0.1 inch or more) washes pollen out of the air and can reduce counts by 30-50% within two hours. But avoid going outside right after rain, as damp ground can stir up mold and re-release pollen when it dries. Heavy storms can also trigger thunderstorm asthma, so stay indoors if thunder is nearby.
Which pollen type is worst in Melbourne?
Ryegrass is the most problematic pollen in Melbourne, peaking from October to December. Tree pollen like eucalyptus and olive is common in late winter and early spring. Ragweed and other weeds affect people from late summer into autumn. Knowing your specific trigger helps you plan better - not all pollen is the same.
Are pollen forecasts reliable?
Modern forecasts are 82-89% accurate for daily predictions, especially in temperate regions like Melbourne. But they can’t predict sudden events like thunderstorm asthma or localized pollen bursts from mowing or gardening. Use forecasts as a guide, not a guarantee. Cross-checking two sources improves reliability.
Should I still use allergy medication if I follow forecasts?
Yes - forecasts help you reduce exposure, but they don’t eliminate it. Combining forecast-based planning with daily antihistamines or nasal sprays gives the best results. Studies show people who use both strategies reduce medication use by 63% and symptom days by up to 65%. Don’t skip meds - use forecasts to use them smarter.
What apps or websites give the best pollen forecasts in Australia?
BreezoMeter offers the most accurate hyperlocal forecasts for Australia with 1.5km resolution. The Bureau of Meteorology provides free regional data. Pollen.com covers Australia but with lower resolution (10km). For real-time alerts, Apple Health now integrates pollen data from BreezoMeter. Check two sources - especially during peak season - to get the full picture.
What to Do Next
Start today. Download one reliable pollen app - BreezoMeter or the Bureau of Meteorology’s allergy section - and check it every night. Mark your calendar for the next 10 days and note the forecast. Then, try scheduling one outdoor activity - a walk, a bike ride, or even just sitting in the garden - for early evening on a low-pollen day. See how you feel. Track it. You might be surprised.
Pollen isn’t going away. But you don’t have to let it control your life. With the right information, you can reclaim your days - and enjoy the fresh air without the sneezing.

Colin Pierce
January 28, 2026 AT 23:21I’ve been using BreezoMeter for two years now and it’s changed my life. I used to hate spring until I started checking the app every night before bed. Now I schedule my runs for 7 PM like clockwork. No more antihistamines by noon. Honestly, if you’re allergic and not using this, you’re just suffering unnecessarily.
Kevin Kennett
January 30, 2026 AT 15:00Stop pretending these forecasts are magic. My neighbor checks his app religiously but still ends up in the ER during thunderstorms. These models don’t account for local variables like backyard mowing or a neighbor’s ragweed patch. You think a satellite knows your backyard is a pollen bomb? Wake up.
Jess Bevis
January 31, 2026 AT 09:13Shower after coming inside. Game changer.
Howard Esakov
February 1, 2026 AT 08:22Anyone who relies on free apps is basically letting Big Pollen win 😏. I pay for the premium BreezoMeter tier with hyperlocal alerts + pollen density heatmaps. If you’re not optimizing your exposure with AI-driven analytics, you’re just a tourist in your own life. 🌿📊
Kathy Scaman
February 1, 2026 AT 13:02I just started using the BOM app and it’s wild how different it is from my phone’s weather widget. I thought I was being careful, but turns out I was timing my walks wrong the whole time. Now I do yoga at 8 PM and feel like a new person. 🙌
Anna Lou Chen
February 3, 2026 AT 00:31Let’s deconstruct the epistemological framework of pollen forecasting. The very notion of quantifying airborne allergens as discrete ‘grains per cubic meter’ is a colonial construct rooted in Cartesian reductionism. Who decided ryegrass is the ‘main culprit’? Is it not a symptom of anthropocene ecological collapse? The forecast isn’t predicting pollen-it’s reinforcing a biomedical hegemony that pathologizes nature itself. 🌱🌀
Lance Long
February 3, 2026 AT 03:27Hey, I get it-this stuff feels overwhelming. But small steps matter. You don’t need to overhaul your life overnight. Just pick one thing: maybe switch your walk to dusk, or start keeping saline spray in your bag. I’ve seen people go from miserable to thriving with just one tweak. You got this. 💪
fiona vaz
February 4, 2026 AT 15:49My mom has COPD and we started using the forecast last year. She went from staying indoors all spring to walking in the park twice a week. It’s not perfect, but it’s the best tool we’ve found. Combine it with her nasal spray and she’s actually enjoying the season again. Small wins, right?
Sue Latham
February 6, 2026 AT 02:08Ugh, I can’t believe people still use free apps. I mean, really? You’re trusting your health to some algorithm that doesn’t even know if your neighbor’s lawn is a grass bomb? I use the premium version with custom trigger alerts and a daily email digest. If you’re not doing that, you’re basically just rolling the dice. 😒
John Rose
February 6, 2026 AT 08:44Interesting data, but I’m curious about the sample size behind the 82–89% accuracy claim. Was that based on urban centers only? How does it hold up in rural or coastal regions? Also, are the machine learning models trained on data from non-English-speaking regions? I’d love to see the methodology.
Lexi Karuzis
February 7, 2026 AT 03:50Wait… so you’re telling me the government and tech companies are tracking pollen… and they’re NOT telling us about the 5G pollen amplifiers? 🤔 I’ve been having panic attacks since 2021-EVERY TIME the forecast says ‘high,’ my heart races. Coincidence? I don’t think so. They’re using pollen to test bioweapons… and you’re just checking your phone?!
Mark Alan
February 8, 2026 AT 12:55USA has the BEST pollen tech. Australia? Pfft. They’re still using 1990s models. I’ve got my Apple Health syncing with BreezoMeter, my Fitbit tracking my oxygen levels, and my smart AC filtering pollen before I even open the door. If you’re not living in the future, you’re just breathing in the past. 🇺🇸🔥
matthew martin
February 8, 2026 AT 19:05My dog sneezes when I take her out at noon. I didn’t even realize she had allergies until I started noticing the pattern. Now I take her at 7 PM and she’s a totally different pup-zoomies, tail wags, the whole deal. Turns out, it’s not just us humans. Our pets are in on this too. 🐶🌿
Jeffrey Carroll
February 9, 2026 AT 11:05The integration of pollen data into public health infrastructure remains underutilized. While individual behavioral adjustments are beneficial, systemic interventions-such as municipal planting policies and public air quality advisories-would yield broader population-level outcomes. Further research into socioeconomic disparities in access to forecasting tools is warranted.
Colin Pierce
February 11, 2026 AT 01:12Actually, I just saw your comment about thunderstorms. You’re right-my friend had a bad one last year after mowing. I started checking the storm radar too now. If there’s a storm coming, I skip the walk even if the pollen count is low. It’s not just the pollen-it’s the micro-particles. Learned that the hard way.